Market Outlook
July20, 2017
Market Cues
Domestic Indices
Chg (%)
(Pts)
(Close)
Indian markets are likely to open in green and may trade in positive zone tracking
BSE Sensex
0.8
244
31,955
global indices.
Nifty
0.7
72
9,900
Following the mixed performance seen in the previous session, US markets moved
Mid Cap
1.0
152
15,259
mostly higher during trading on Wednesday. With the upward move on the day, all
Small Cap
1.0
157
15,975
three major averages reached new record closing highs. Buying interest was
Bankex
0.6
172
27,375
generated in reaction to a report from the Commerce Department showing a bigger
than expected rebound in housing starts in the month of June.
Global Indices
Chg (%)
(Pts)
(Close)
The majority of the European markets ended Wednesdays session with small gains.
After a relatively flat performance in early trade, the markets logged some gains in
Dow Jones
0.3
166
21,641
the afternoon. Traders were encouraged by some better than expected corporate
Nasdaq
0.6
41
6,385
earnings reports, but remained cautious ahead of tomorrow's announcements from
FTSE
0.6
41
7,431
the Bank of Japan and the European Central Bank.
Nikkei
(00.1
21
20,021
Indian markets ended Wednesdays session on a strong note, with firm global cues
Hang Seng
0.6
147
26,672
and encouraging earnings updates from the likes of Hindustan Unilever and Mastek
Shanghai Com
1.4
43
3,231
helping underpin investor sentiment.
Advances / Declines
BSE
NSE
News Analysis
Advances
1,732
1,121
Aurobindo Pharma gets USFDA approval to market kidney ailment drug
Declines
1,985
544
Detailed analysis is on Pg2
Unchanged
152
91
Investor’s Ready Reckoner
Volumes (` Cr)
Key Domestic & Global Indicators
BSE
4,874
Stock Watch: Latest investment recommendations on 150+ stocks
Refer Pg6 onwards
NSE
27,616
Top Picks
#Net Inflows (` Cr)
Net
Mtd
Ytd
CMP
Target
Upside
Company
Sector
Rating
(`)
(`)
(%)
FII
(56376
(2,2330
56,238
Blue Star
Capital Goods
Buy
662
760
14.8
MFs
(187)
4,475
43,621
Dewan Housing FinanceFinancials
Buy
469
520
10.8
Mahindra Lifespace
Real Estate
Buy
439
522
19.0
Top Gainers
Price (`)
Chg (%)
Navkar Corporation
Others
Buy
202
265
31.5
KEI Industries
Capital Goods
Accumulate
240
258
7.6
Idea cem
195
9.0
More Top Picks on Pg3
Strtech
172
9.0
Key Upcoming Events
Kec
315
6.5
Previous
Consensus
Date
Region
Event Description
Fconsumer
44
6.4
Reading
Expectations
Mrpl
131
6.3
Jul 20, 2017
Euro Zone Euro-Zone Consumer Confidence
(1.30)
(1.20)
Jul20, 2017
US
Initial Jobless claims
247.00
245.00
Jul 20, 2017
Euro Zone ECB announces interest rates
-
-
Top Losers
Price (`)
Chg (%)
Jul 24, 2017
US
Existing home sales
5.62
5.54
Videoind
226
(4.9)
Jul 24, 2017
Germany PMI Services
54.00
Hcl-Insys
54
(4.0)
More Events on Pg4
Grasim
1,050
(3.7)
Aegislog
183
(3.4)
Jublfood
1,290
(2.7)
#as on 19t July, 2017
Market Outlook
July20, 2017
News Analysis
Aurobindo Pharma gets USFDA approval to market kidney ailment drug
Aurobindo Pharma Limited announced on Wednesday that it has received the final
approval from US Food and Drug Administration (USFDA) to manufacture
Sevelamer Carbonate tablets 800 mg. Used to lower high blood phosphorus levels
in patients who are on dialysis, Sevelamer Carbonate tablets are a therapeutic
equivalent generic version of Genzyme's Renvela tablets.
The product, which is being launched immediately, is a significant event for the
company as it has an estimated market size off $1.9bn for the twelve months
ending May 2017, according to IMS. This is the 124th ANDA (Abbreviated New
Drug Application) to be approved out of Unit VII formulation facility in Hyderabad,
according to Aurobindo.
Economic and Political News
GST: Revenue from imports up 11% at `12,673Cr in 15 days, says CBEC
7 mn taxpayers have successfully activated GST accounts: GSTN Chairman
All states may notify rules under RERA by July-end, says Govt
J&K govt violates budget provisions by spending `1,961Cr in FY 16: CAG
Govt nod to Cement Corp of India revival, non-operating units' closure
Corporate News
Bajaj Finserv Q1 net profit up 24% at `1,016Cr
Zydus gets USFDA nod to market Tranexamic acid injection
Lupin recalls 12,480 bottles of anti-depressant drug from US
Sterlite Tech Q1 net profit up 61% to `60.6Cr
Market Outlook
July20, 2017
Top Picks HHHHH
Market Cap
CMP
Target
Upside
Company
Rationale
(` Cr)
(`)
(`)
(%)
Strong growth in domestic business due to its leadership
in acute therapeutic segment. Alkem expects to launch
Alkem Laboratories
21,314
1,783
2,161
21.2
more products in USA, which bodes for its international
business.
We expect the company would report strong profitability
Asian Granito
1,290
429
480
12.0
owing to better product mix, higher B2C sales and
amalgamation synergy.
Favourable outlook for the AC industry to augur well for
Cooling products business which is out pacing the
Blue Star
6,342
662
760
14.8
market growth. EMPPAC division's profitability to improve
once operating environment turns around.
With a focus on the low and medium income (LMI)
consumer segment, the company has increased its
Dewan Housing Finance
14,713
469
520
10.8
presence in tier-II & III cities where the growth
opportunity is immense.
Loan growth is likely to pick up after a sluggish FY17.
Karur Vysya Bank
8,403
139
160
15.1
Lower credit cost will help in strong bottomline growth.
Increasing share of CASA will help in NIM improvement.
High order book execution in EPC segment, rising B2C
KEI Industries
1,866
240
258
7.6
sales and higher exports to boost the revenues and
profitability
Speedier execution and speedier sales, strong revenue
Mahindra Lifespace
2,251
439
522
19.0
visibilty in short-to-long run, attractive valuations
Massive capacity expansion along with rail advantage at
Navkar Corporation
2,874
202
265
31.5
ICD as well CFS augurs well for the company
Strong brands and distribution network would boost
Siyaram Silk Mills
2,299
2,453
2,500
3.0
growth going ahead. Stock currently trades at an
inexpensive valuation.
Market leadership in Hindi news genre and no.
2
viewership ranking in English news genre, exit from the
TV Today Network
1,510
253
344
35.9
radio business, and anticipated growth in ad spends by
corporates to benefit the stock.
After GST, the company is expected to see higher
volumes along with improving product mix. The Gujarat
Maruti
2,28,400
7,561
8,495
12.4
plant will also enable higher operating leverage which
will be margin accretive.
Source: Company, Angel Research,
Market Outlook
July20, 2017
Quarterly Bloomberg Brokers Consensus Estimate
Reliance Industries - July 20, 2017
Particulars ( ` cr)
1QFY18E
1QFY17
y-o-y (%)
4QFY17
q-o-q (%)
Net sales
61,526
53,496
15.0
67,146
(8.4)
EBITDA
11,230
10,817
3.8
11,280
(0.4)
EBITDA margin (%)
18.3
20.2
16.8
Net profit
8,075
7,548
7.0
8,151
(0.9)
Wipro - July 20, 2017
Particulars ( ` cr)
1QFY18E
1QFY17
y-o-y (%)
4QFY17
q-o-q (%)
Net sales
13,312
13,599
(2.1)
13,988
(4.8)
EBITDA
2,640
2,653
(0.5)
3,226
(18.2)
EBITDA margin (%)
19.8
19.5
23.1
Net profit
2,011
2,052
(2.0)
1,994
0.8
Bajaj Auto - July 20, 2017
Particulars ( ` cr)
1QFY18E
1QFY17
y-o-y (%)
4QFY17
q-o-q (%)
Net sales
5,528
5,644
(2.1)
4,805
15.0
EBITDA
1,078
1,176
(8.4)
906
19.0
EBITDA margin (%)
19.5
20.8
18.9
Net profit
905
978
(7.5)
801.8
12.8
ABB - July 20, 2017
Particulars ( ` cr)
1QFY18E
1QFY17
y-o-y (%)
4QFY17
q-o-q (%)
Net sales
2,354
2,074
13.5
2,146
9.7
EBITDA
181
170
6.6
171
5.7
EBITDA margin (%)
7.7
8.2
8.0
Net profit
92
77
19.2
88.1
4.42
Kotak Bank - July 20, 2017
Particulars ( ` cr)
1QFY18E
1QFY17
y-o-y (%)
4QFY17
q-o-q (%)
Net profit
953
742
28.4
976
(2.5)
Market Outlook
July 20, 2017
Key Upcoming Events
Global economic events release calendar
Bloomberg Data
Date
Time
Country
Event Description
Unit
Period
Last Reported
Estimated
Jul 20, 2017
7:30 PMEuro Zone
Euro-Zone Consumer Confidence
Value
Jul A
(1.30)
(1.20)
6:00 PMUS
Initial Jobless claims
Thousands
Jul 15
247.00
245.00
5:15 PMEuro Zone
ECB announces interest rates
%
Jul 20
-
-
Jul 24, 2017
7:30 PMUS
Existing home sales
Million
Jun
5.62
5.54
1:00 PMGermany
PMI Services
Value
Jul P
54.00
1:00 PMGermany
PMI Manufacturing
Value
Jul P
59.60
Jul 25, 2017
7:30 PMUS
Consumer Confidence
S.A./ 1985=100
Jul
118.90
116.00
Jul 26, 2017
2:00 PMUK
GDP (YoY)
% Change
2Q A
2.00
7:30 PMUS
New home sales
Thousands
Jun
610.00
615.50
11:30 PMUS
FOMC rate decision
%
Jul 26
1.25
1.25
Jul 28, 2017
6:00 PMUS
GDP Qoq (Annualised)
% Change
2Q A
1.40
2.60
Jul 31, 2017
6:30 AMChina
PMI Manufacturing
Value
Jul
51.70
Aug 01, 2017
1:25 PMGermany
Unemployment change (000's)
Thousands
Jul
7.00
2:00 PMUK
PMI Manufacturing
Value
Jul
54.30
2:30 PMEuro Zone
Euro-Zone GDP s.a. (QoQ)
% Change
2Q A
0.60
Aug 02, 2017
2:30 PMIndia
RBI Repo rate
%
Aug 2
6.25
2:30 PMIndia
RBI Reverse Repo rate
%
Aug 2
6.00
2:30 PMIndia
RBI Cash Reserve ratio
%
Aug 2
4.00
Aug 03, 2017
4:30 PMUK
BOE Announces rates
% Ratio
Aug 3
0.25
0.25
Aug 04, 2017
6:00 PMUS
Change in Nonfarm payrolls
Thousands
Jul
222.00
175.00
6:00 PMUS
Unnemployment rate
%
Jul
4.40
4.30
Source: Bloomberg, Angel Research
Market Outlook
July 20, 2017
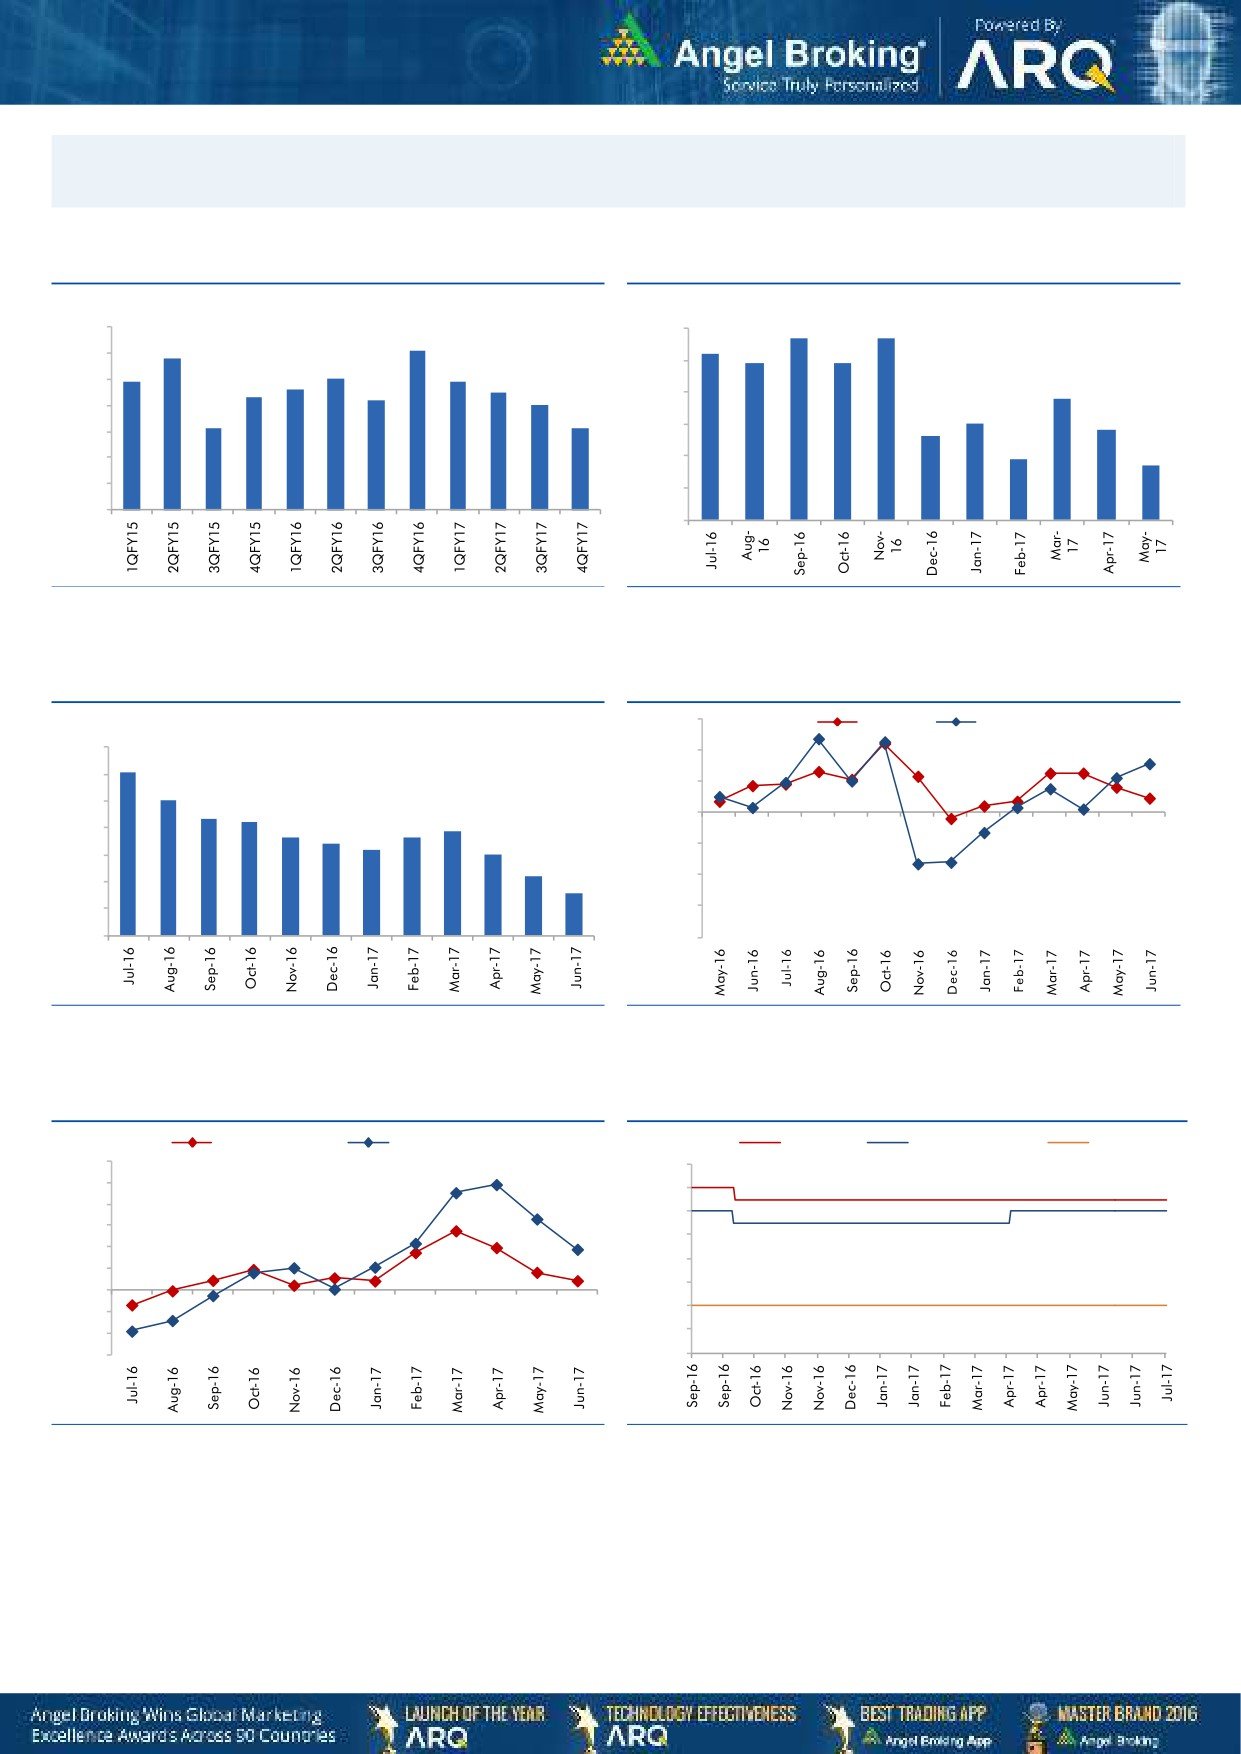
Macro watch
Exhibit 1: Quarterly GDP trends
Exhibit 2: IIP trends
(%)
(%)
5.7
5.7
10.0
6.0
9.1
5.2
8.8
4.9
4.9
9.0
7.9
8.0
7.9
5.0
7.6
7.5
8.0
7.3
7.2
3.8
7.0
4.0
7.0
3.0
6.1
6.1
2.8
2.6
3.0
6.0
1.9
1.7
5.0
2.0
4.0
1.0
3.0
-
Source: CSO, Angel Research
Source: MOSPI, Angel Research
Exhibit 3: Monthly CPI inflation trends
Exhibit 4: Manufacturing and services PMI
56.0
Mfg. PMI
Services PMI
(%)
7.0
54.0
6.1
6.0
5.1
52.0
5.0
4.3
4.2
3.9
50.0
3.6
3.7
4.0
3.4
3.2
3.0
48.0
3.0
2.2
1.5
46.0
2.0
1.0
44.0
-
42.0
Source: MOSPI, Angel Research
Source: Market, Angel Research; Note: Level above 50 indicates expansion
Exhibit 5: Exports and imports growth trends
Exhibit 6: Key policy rates
(%)
Exports yoy growth
Imports yoy growth
(%)
Repo rate
Reverse Repo rate
CRR
60.0
7.00
50.0
6.50
40.0
6.00
30.0
5.50
20.0
5.00
10.0
4.50
0.0
4.00
(10.0)
(20.0)
3.50
(30.0)
3.00
Source: Bloomberg, Angel Research
Source: RBI, Angel Research
Market Outlook
July 20, 2017
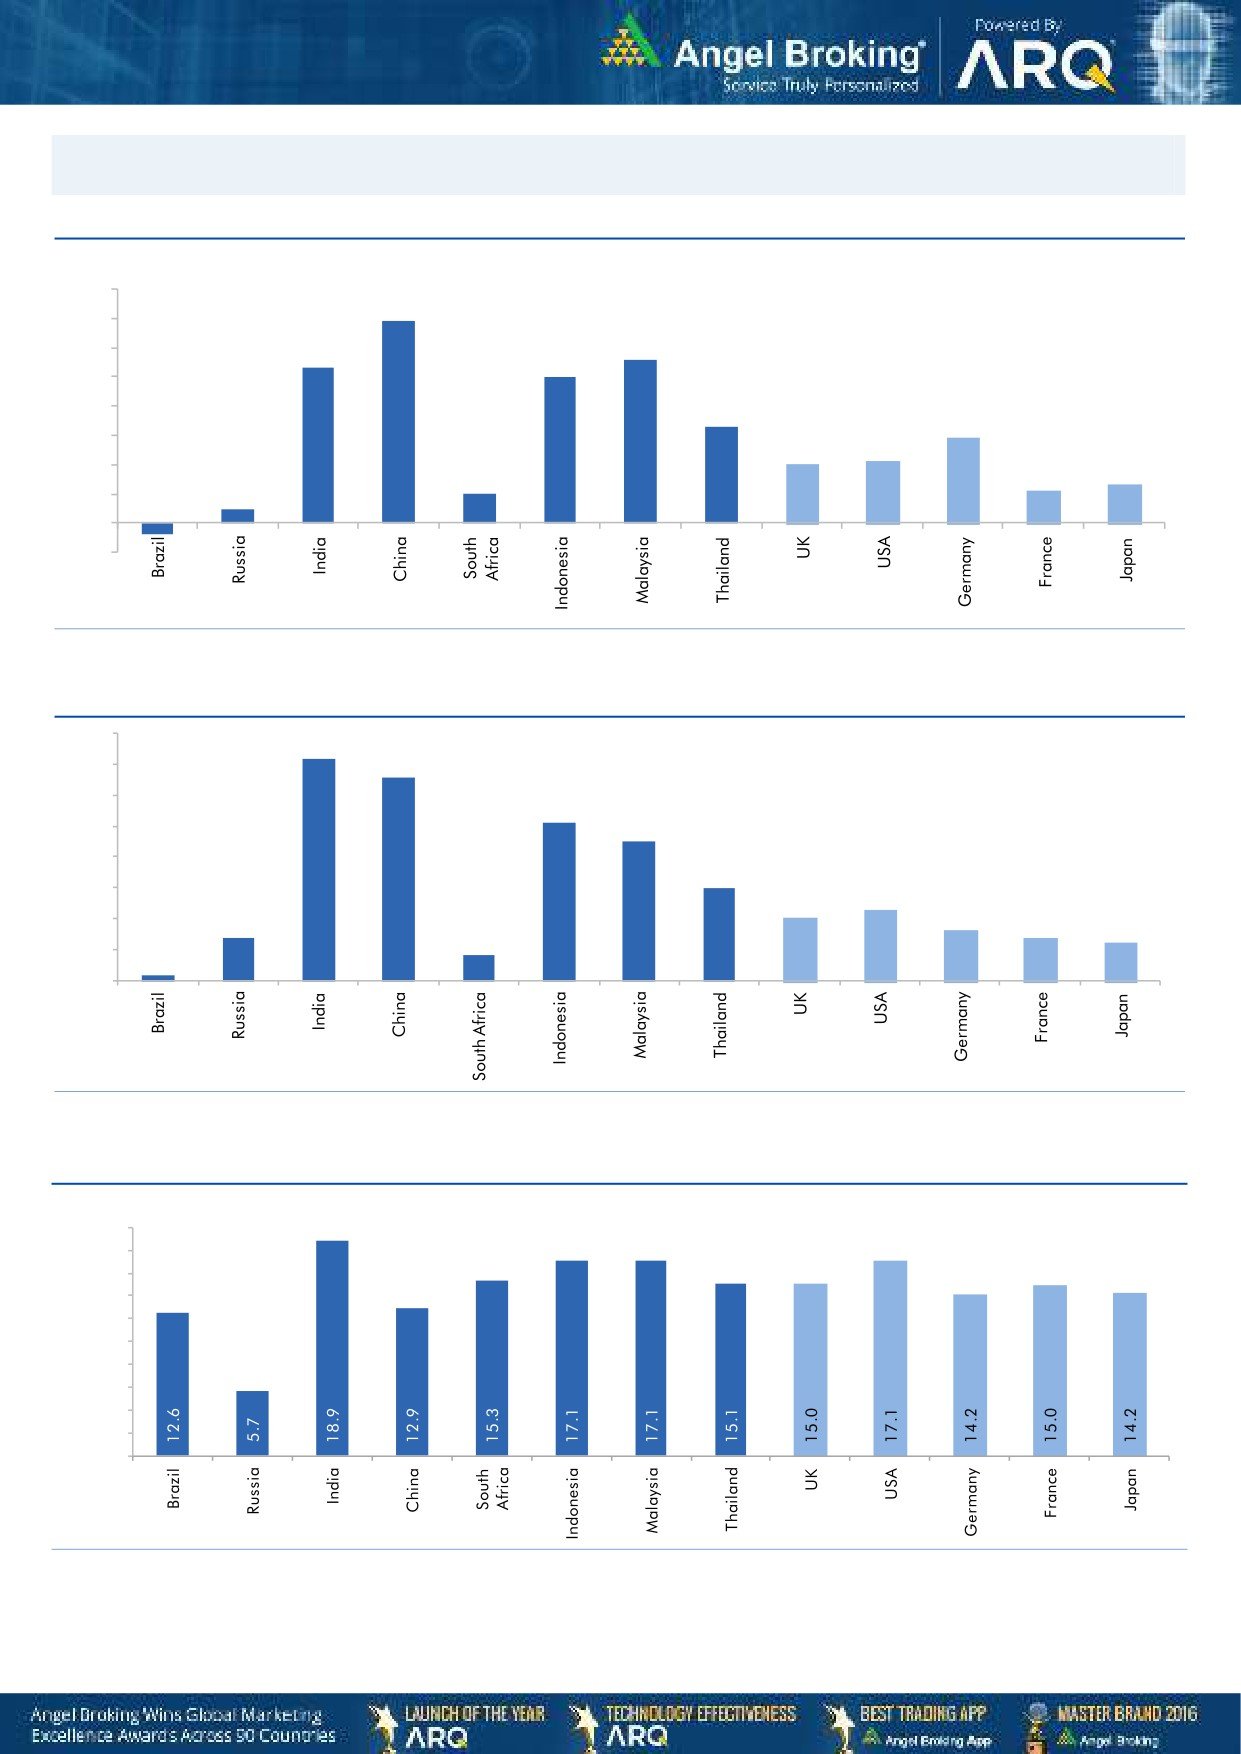
Global watch
Exhibit 1: Latest quarterly GDP Growth (%, yoy) across select developing and developed countries
(%)
8.0
6.9
7.0
5.6
6.0
5.3
5.0
1.0
5.0
4.0
3.3
2.9
3.0
2.0
2.1
2.0
0.5
1.1
1.3
1.0
-
(1.0)
(0.4)
Source: Bloomberg, Angel Research
Exhibit 2: 2016 GDP Growth projection by IMF (%, yoy) across select developing and developed countries
(%)
7.2
6.6
7.0
6.0
5.1
5.0
4.5
4.0
3.0
3.0
2.3
2.0
1.4
1.6
2.0
1.4
1.2
0.2
0.8
1.0
-
Source: IMF, Angel Research
Exhibit 3: One year forward P-E ratio across select developing and developed countries
(x)
20.0
18.0
16.0
14.0
12.0
10.0
8.0
6.0
4.0
2.0
-
Source: IMF, Angel Research
Market Outlook
July 20, 2017
Exhibit 4: Relative performance of indices across globe
Returns (%)
Country
Name of index
Closing price
1M
3M
1YR
Brazil
Bovespa
65,180
5.1
1.3
17.3
Russia
Micex
1,952
5.5
1.9
1.3
India
Nifty
9,900
3.2
8.7
15.6
China
Shanghai Composite
3,231
2.8
1.0
8.1
South Africa
Top 40
47,749
5.2
2.4
2.8
Mexico
Mexbol
51,087
3.9
4.5
7.5
Indonesia
LQ45
972
2.1
3.5
13.8
Malaysia
KLCI
1,757
(1.8)
1.1
6.2
Thailand
SET 50
1,000
0.8
0.0
7.4
USA
Dow Jones
21,641
1.2
5.4
16.4
UK
FTSE
7,431
(1.2)
4.0
10.9
Japan
Nikkei
20,021
0.4
9.2
27.4
Germany
DAX
12,452
(3.4)
3.8
22.1
France
CAC
5,216
(1.8)
4.2
17.3
Source: Bloomberg, Angel Research, #Data as on 19th July
Stock Watch
July 20, 2017
Company Name
Reco
CMP
Target
Mkt Cap
Sales ( Čcr )
OPM(%)
EPS (Č)
PER(x)
P/BV(x)
RoE(%)
EV/Sales(x)
(Č)
Price ( Č)
( Č cr )
FY17E FY18E
FY17E
FY18E
FY17E
FY18E
FY17E
FY18E
FY17E
FY18E
FY17E
FY18E
FY17E
FY18E
Agri / Agri Chemical
Rallis
Reduce
245
209
4,769
1,937
2,164
13.3
14.3
9.0
11.0
27.3
22.3
4.7
4.1
18.4
19.8
2.5
2.2
United Phosphorus
Neutral
859
-
43,612
15,176
17,604
18.5
18.5
37.4
44.6
23.0
19.3
4.5
3.7
21.4
21.2
3.0
2.5
Auto & Auto Ancillary
Ashok Leyland
Accumulate
107
116
31,285
20,019
22,789
11.1
11.7
4.3
5.5
24.9
19.5
4.8
4.3
19.4
22.0
1.5
1.3
Bajaj Auto
Neutral
2,825
-
81,739
25,093
27,891
19.5
19.2
143.9
162.5
19.6
17.4
5.5
4.7
30.3
29.4
3.0
2.6
Bharat Forge
Neutral
1,148
-
26,732
7,726
8,713
20.5
21.2
35.3
42.7
32.5
26.9
6.0
5.4
18.9
20.1
3.5
3.1
Eicher Motors
Neutral
29,215
-
79,529
16,583
20,447
17.5
18.0
598.0
745.2
48.9
39.2
16.7
12.7
41.2
38.3
4.6
3.7
Gabriel India
Neutral
148
-
2,119
1,544
1,715
9.0
9.3
5.4
6.3
27.3
23.4
5.2
4.6
18.9
19.5
1.3
1.2
Hero Motocorp
Neutral
3,766
-
75,210
28,120
30,753
15.2
15.6
169.1
189.2
22.3
19.9
7.7
6.4
30.8
28.2
2.5
2.2
Jamna Auto Industries Neutral
262
-
2,085
1,486
1,620
9.8
9.9
15.0
17.2
17.4
15.2
3.8
3.2
21.8
21.3
1.5
1.3
L G Balakrishnan & Bros Neutral
786
-
1,234
1,302
1,432
11.6
11.9
43.7
53.0
18.0
14.8
2.5
2.3
13.8
14.2
1.0
0.9
Mahindra and Mahindra Neutral
1,383
-
85,922
46,534
53,077
11.6
11.7
67.3
78.1
20.6
17.7
3.3
2.9
15.4
15.8
1.8
1.6
Maruti
Accumulate
7,561
8,495
228,400
67,822
83,717
15.2
15.0
243.0
291.5
31.1
25.9
7.1
5.8
22.9
22.4
3.0
2.4
Minda Industries
Neutral
680
-
5,878
2,728
3,042
9.0
9.1
68.2
86.2
10.0
7.9
2.3
1.8
23.8
24.3
2.2
2.0
Motherson Sumi
Neutral
326
-
68,660
45,896
53,687
7.8
8.3
13.0
16.1
25.0
20.3
8.1
6.4
34.7
35.4
1.6
1.3
Rane Brake Lining
Neutral
1,358
-
1,075
511
562
11.3
11.5
28.1
30.9
48.3
43.9
7.4
6.7
15.3
15.0
2.2
2.1
Setco Automotive
Neutral
43
-
574
741
837
13.0
13.0
15.2
17.0
2.8
2.5
0.5
0.4
15.8
16.3
1.2
1.1
Tata Motors
Neutral
461
-
132,977
300,209
338,549
8.9
8.4
42.7
54.3
10.8
8.5
1.7
1.5
15.6
17.2
0.6
0.5
TVS Motor
Neutral
574
-
27,253
13,390
15,948
6.9
7.1
12.8
16.5
45.0
34.7
11.2
8.9
26.3
27.2
2.1
1.7
Amara Raja Batteries
Buy
835
962
14,268
5,339
6,220
15.9
15.3
28.0
32.3
29.8
25.9
5.7
4.8
19.1
18.5
2.7
2.3
Exide Industries
Neutral
218
-
18,543
7,439
8,307
15.0
15.0
8.1
9.3
26.9
23.5
3.8
3.4
14.3
16.7
2.1
1.9
Apollo Tyres
Neutral
256
-
13,018
12,877
14,504
14.3
13.9
21.4
23.0
11.9
11.1
1.9
1.6
16.4
15.2
1.2
1.1
Ceat
Neutral
1,852
-
7,492
7,524
8,624
13.0
12.7
131.1
144.3
14.1
12.8
2.6
2.2
19.8
18.6
1.1
0.9
JK Tyres
Neutral
163
-
3,705
7,455
8,056
15.0
15.0
21.8
24.5
7.5
6.7
1.6
1.3
22.8
21.3
0.6
0.5
Swaraj Engines
Neutral
2,178
-
2,705
660
810
15.2
16.4
54.5
72.8
40.0
29.9
12.5
11.3
31.5
39.2
3.9
3.2
Subros
Neutral
243
-
1,460
1,488
1,681
11.7
11.9
6.4
7.2
38.0
34.0
4.0
3.6
10.8
11.4
1.2
1.1
Indag Rubber
Neutral
203
-
532
286
326
19.8
16.8
11.7
13.3
17.3
15.2
2.9
2.7
17.8
17.1
1.5
1.3
Capital Goods
ACE
Neutral
72
-
707
709
814
4.1
4.6
1.4
2.1
51.1
34.1
2.1
2.0
4.4
6.0
1.2
1.0
BEML
Neutral
1,543
-
6,424
3,451
4,055
6.3
9.2
31.4
57.9
49.1
26.6
3.0
2.7
6.3
10.9
2.0
1.7
Bharat Electronics
Neutral
174
-
38,787
8,137
9,169
16.8
17.2
58.7
62.5
3.0
2.8
0.5
0.4
44.6
46.3
3.7
3.4
Stock Watch
July 20, 2017
Company Name
Reco
CMP
Target
Mkt Cap
Sales ( Čcr )
OPM(%)
EPS (Č)
PER(x)
P/BV(x)
RoE(%)
EV/Sales(x)
(Č)
Price ( Č)
( Č cr )
FY17E
FY18E
FY17E
FY18E
FY17E
FY18E
FY17E
FY18E
FY17E
FY18E
FY17E
FY18E
FY17E
FY18E
Capital Goods
Voltas
Neutral
494
-
16,344
6,511
7,514
7.9
8.7
12.9
16.3
38.3
30.3
6.9
6.0
16.7
18.5
2.3
1.9
BGR Energy
Neutral
152
-
1,094
16,567
33,848
6.0
5.6
7.8
5.9
19.4
25.7
1.1
1.1
4.7
4.2
0.2
0.1
BHEL
Neutral
145
-
35,527
28,797
34,742
-
2.8
2.3
6.9
63.1
21.0
1.1
1.0
1.3
4.8
0.9
0.6
Blue Star
Accumulate
662
760
6,342
4,283
5,077
5.9
7.3
14.9
22.1
44.5
29.9
8.6
7.3
20.4
26.4
1.5
1.3
CG Power and Industrial
Neutral
85
-
5,349
5,777
6,120
5.9
7.0
3.3
4.5
25.9
19.0
1.1
1.1
4.4
5.9
0.9
0.8
Solutions
Greaves Cotton
Neutral
163
-
3,981
1,755
1,881
16.8
16.9
7.8
8.5
20.9
19.2
4.2
3.9
20.6
20.9
2.0
1.8
Inox Wind
Neutral
145
-
3,217
5,605
6,267
15.7
16.4
24.8
30.0
5.8
4.8
1.6
1.2
25.9
24.4
0.6
0.5
KEC International
Neutral
311
-
8,004
9,294
10,186
7.9
8.1
9.9
11.9
31.5
26.2
4.6
4.0
15.6
16.3
1.1
1.0
KEI Industries
Accumulate
240
258
1,866
2,633
3,001
10.4
10.0
12.7
13.0
18.9
18.4
4.0
3.4
21.4
18.2
0.9
0.8
Thermax
Neutral
917
-
10,928
5,421
5,940
7.3
7.3
25.7
30.2
35.7
30.4
4.3
3.9
12.2
13.1
1.9
1.7
VATech Wabag
Neutral
668
-
3,647
3,136
3,845
8.9
9.1
26.0
35.9
25.7
18.6
3.2
2.7
13.4
15.9
1.1
0.8
Cement
ACC
Neutral
1,733
-
32,549
11,225
13,172
13.2
16.9
44.5
75.5
39.0
23.0
3.7
3.4
11.2
14.2
2.9
2.5
Ambuja Cements
Neutral
264
-
52,441
9,350
10,979
18.2
22.5
5.8
9.5
45.5
27.8
3.8
3.4
10.2
12.5
5.6
4.8
India Cements
Neutral
209
-
6,440
4,364
4,997
18.5
19.2
7.9
11.3
26.5
18.5
1.9
1.9
8.0
8.5
2.2
2.0
JK Cement
Neutral
977
-
6,828
4,398
5,173
15.5
17.5
31.2
55.5
31.3
17.6
3.8
3.3
12.0
15.5
2.1
1.7
J K Lakshmi Cement
Neutral
469
-
5,521
2,913
3,412
14.5
19.5
7.5
22.5
62.6
20.9
3.9
3.2
12.5
18.0
2.5
2.1
Orient Cement
Neutral
160
-
3,271
2,114
2,558
18.5
20.5
8.1
11.3
19.7
14.1
2.9
2.5
9.0
14.0
2.2
1.7
UltraTech Cement
Neutral
4,207
-
115,491
25,768
30,385
21.0
23.5
111.0
160.0
37.9
26.3
4.8
4.2
13.5
15.8
4.6
3.8
Construction
ITNL
Neutral
95
-
3,130
8,946
10,017
31.0
31.6
8.1
9.1
11.8
10.5
0.4
0.4
4.2
5.0
3.7
3.4
KNR Constructions
Neutral
210
-
2,953
1,385
1,673
14.7
14.0
41.2
48.5
5.1
4.3
1.0
0.8
14.9
15.2
2.2
1.8
Larsen & Toubro
Buy
1,181
1,700
165,355
111,017
124,908
11.0
11.0
61.1
66.7
19.3
17.7
2.3
2.2
13.1
12.9
2.5
2.3
Gujarat Pipavav Port
Neutral
143
-
6,916
705
788
52.2
51.7
5.0
5.6
28.6
25.5
2.8
2.5
11.2
11.2
9.5
8.0
Nagarjuna Const.
Neutral
92
-
5,109
8,842
9,775
9.1
8.8
5.3
6.4
17.3
14.4
1.4
1.3
8.2
9.1
0.7
0.6
PNC Infratech
Neutral
142
-
3,642
2,350
2,904
13.1
13.2
9.0
8.8
15.8
16.1
0.6
0.5
15.9
13.9
1.7
1.4
Simplex Infra
Neutral
517
-
2,555
6,829
7,954
10.5
10.5
31.4
37.4
16.5
13.8
1.7
1.6
9.9
13.4
0.8
0.7
Power Mech Projects
Neutral
584
-
859
1,801
2,219
12.7
14.6
72.1
113.9
8.1
5.1
1.5
1.3
16.8
11.9
0.5
0.4
Sadbhav Engineering
Accumulate
283
298
4,854
3,598
4,140
10.3
10.6
9.0
11.9
31.4
23.8
3.3
2.9
9.9
11.9
1.6
1.4
NBCC
Neutral
211
-
18,972
7,428
9,549
7.9
8.6
8.2
11.0
25.7
19.2
1.3
1.0
28.2
28.7
2.3
1.7
MEP Infra
Neutral
126
-
2,052
1,877
1,943
30.6
29.8
3.0
4.2
42.1
30.1
20.4
13.7
0.6
0.6
2.5
2.3
Stock Watch
July 20, 2017
Company Name
Reco
CMP
Target
Mkt Cap
Sales ( Čcr )
OPM(%)
EPS (Č)
PER(x)
P/BV(x)
RoE(%)
EV/Sales(x)
(Č)
Price ( Č)
( Č cr )
FY17E
FY18E
FY17E
FY18E
FY17E
FY18E
FY17E
FY18E
FY17E
FY18E
FY17E
FY18E
FY17E
FY18E
Construction
SIPL
Neutral
106
-
3,744
1,036
1,252
65.5
66.2
(8.4)
(5.6)
4.0
4.5
(22.8)
(15.9)
11.8
9.8
Engineers India
Neutral
157
-
10,587
1,725
1,935
16.0
19.1
11.4
13.9
13.8
11.3
1.9
1.8
13.4
15.3
5.1
4.5
Financials
Axis Bank
Accumulate
520
580
124,689
46,932
53,575
3.5
3.4
32.4
44.6
16.1
11.7
2.1
1.8
13.6
16.5
-
-
Bank of Baroda
Neutral
164
-
37,869
19,980
23,178
1.8
1.8
11.5
17.3
14.3
9.5
1.6
1.4
8.3
10.1
-
-
Canara Bank
Neutral
371
-
22,159
15,225
16,836
1.8
1.8
14.5
28.0
25.6
13.3
1.8
1.4
5.8
8.5
-
-
Can Fin Homes
Neutral
3,183
-
8,473
420
526
3.5
3.5
86.5
107.8
36.8
29.5
7.9
6.5
23.6
24.1
-
-
Cholamandalam Inv. &
Accumulate
1,149
1,230
17,955
2,012
2,317
6.3
6.3
42.7
53.6
26.9
21.4
4.3
3.7
16.9
18.3
-
-
Fin. Co.
Dewan Housing Finance Accumulate
469
520
14,713
2,225
2,688
2.9
2.9
29.7
34.6
15.8
13.6
2.6
1.7
16.1
14.8
-
-
Equitas Holdings
Buy
170
235
5,754
939
1,281
11.7
11.5
5.8
8.2
29.3
20.7
2.5
2.3
10.9
11.5
-
-
Federal Bank
Accumulate
115
125
22,413
8,259
8,995
3.0
3.0
4.3
5.6
26.8
20.6
2.3
2.1
8.5
10.1
-
-
HDFC
Neutral
1,655
-
263,632
11,475
13,450
3.4
3.4
45.3
52.5
36.5
31.5
7.0
6.2
20.2
20.5
-
-
HDFC Bank
Neutral
1,693
-
435,655
46,097
55,433
4.5
4.5
58.4
68.0
29.0
24.9
5.1
4.3
18.8
18.6
-
-
ICICI Bank
Neutral
302
-
193,702
42,800
44,686
3.1
3.3
18.0
21.9
16.8
13.8
2.3
2.1
11.1
12.3
-
-
Karur Vysya Bank
Buy
139
160
8,403
5,640
6,030
3.3
3.2
8.9
10.0
15.6
13.9
1.7
1.5
11.2
11.4
-
-
Lakshmi Vilas Bank
Neutral
201
-
3,860
3,339
3,799
2.7
2.8
11.0
14.0
18.3
14.4
1.9
1.7
11.2
12.7
-
-
LIC Housing Finance
Neutral
751
-
37,880
3,712
4,293
2.6
2.5
39.0
46.0
19.3
16.3
3.6
3.1
19.9
20.1
-
-
Punjab Natl.Bank
Neutral
158
-
33,696
23,532
23,595
2.3
2.4
6.8
12.6
23.3
12.6
3.6
2.6
3.3
6.5
-
-
RBL Bank
Neutral
538
-
20,247
1,783
2,309
2.6
2.6
12.7
16.4
42.3
32.8
4.6
4.1
12.8
13.3
-
-
Repco Home Finance
Neutral
813
-
5,087
388
457
4.5
4.2
30.0
38.0
27.1
21.4
4.5
3.8
18.0
19.2
-
-
South Ind.Bank
Neutral
29
-
5,140
6,435
7,578
2.5
2.5
2.7
3.1
10.6
9.2
1.4
1.1
10.1
11.2
-
-
St Bk of India
Neutral
293
-
253,092
88,650
98,335
2.6
2.6
13.5
18.8
21.7
15.6
2.1
1.8
7.0
8.5
-
-
Union Bank
Neutral
156
-
10,738
13,450
14,925
2.3
2.3
25.5
34.5
6.1
4.5
0.9
0.8
7.5
10.2
-
-
Yes Bank
Neutral
1,563
-
71,513
8,978
11,281
3.3
3.4
74.0
90.0
21.1
17.4
4.0
3.4
17.0
17.2
-
-
FMCG
Akzo Nobel India
Neutral
1,802
-
8,643
2,955
3,309
13.3
13.7
57.2
69.3
31.5
26.0
10.3
8.7
32.7
33.3
2.7
2.4
Asian Paints
Neutral
1,156
-
110,893
17,128
18,978
16.8
16.4
19.1
20.7
60.5
55.9
21.1
19.9
34.8
35.5
6.4
5.8
Britannia
Neutral
3,808
-
45,719
9,594
11,011
14.6
14.9
80.3
94.0
47.4
40.5
19.5
15.1
41.2
-
4.6
4.0
Colgate
Neutral
1,071
-
29,138
4,605
5,149
23.4
23.4
23.8
26.9
45.0
39.8
24.9
19.5
64.8
66.8
6.3
5.6
Dabur India
Neutral
307
-
54,035
8,315
9,405
19.8
20.7
8.1
9.2
37.9
33.3
10.5
8.7
31.6
31.0
6.2
5.4
GlaxoSmith Con*
Neutral
5,466
-
22,987
4,350
4,823
21.2
21.4
179.2
196.5
30.5
27.8
8.1
6.9
27.1
26.8
4.7
4.1
Stock Watch
July 20, 2017
Company Name
Reco
CMP
Target
Mkt Cap
Sales ( Čcr )
OPM(%)
EPS (Č)
PER(x)
P/BV(x)
RoE(%)
EV/Sales(x)
(Č)
Price ( Č)
( Č cr )
FY17E FY18E
FY17E
FY18E
FY17E
FY18E
FY17E
FY18E
FY17E
FY18E
FY17E
FY18E
FY17E
FY18E
FMCG
Godrej Consumer
Neutral
960
-
65,419
10,235
11,428
18.4
18.6
41.1
44.2
23.4
21.7
5.2
4.4
24.9
24.8
6.5
5.7
HUL
Neutral
1,153
-
249,541
35,252
38,495
17.8
17.8
20.7
22.4
55.8
51.5
53.4
45.8
95.6
88.9
6.9
6.3
ITC
Neutral
292
-
354,517
40,059
44,439
38.3
39.2
9.0
10.1
32.5
28.8
9.1
7.9
27.8
27.5
8.4
7.5
Marico
Neutral
331
-
42,669
6,430
7,349
18.8
19.5
6.4
7.7
51.7
42.9
15.6
13.1
33.2
32.5
6.5
5.6
Nestle*
Neutral
6,935
-
66,862
10,073
11,807
20.7
21.5
124.8
154.2
55.6
45.0
22.8
20.5
34.8
36.7
6.5
5.5
Tata Global
Neutral
175
-
11,038
8,675
9,088
9.8
9.8
7.4
8.2
23.6
21.3
1.9
1.8
7.9
8.1
1.2
1.1
Procter & Gamble
Neutral
8,150
-
26,456
2,939
3,342
23.2
23.0
146.2
163.7
55.8
49.8
14.1
11.7
25.3
23.5
8.5
7.4
Hygiene
IT
HCL Tech^
Accumulate
895
1,014
127,665
46,723
52,342
22.1
20.9
60.0
62.8
14.9
14.3
3.8
3.2
25.3
22.4
2.5
2.1
Infosys
Buy
980
1,179
225,078
68,484
73,963
26.0
26.0
63.0
64.0
15.6
15.3
3.3
3.0
20.8
19.7
3.0
2.6
TCS
Accumulate
2,450
2,651
482,844
117,966
127,403
27.5
27.6
134.3
144.5
18.3
17.0
5.4
5.0
29.8
29.7
3.7
3.5
Tech Mahindra
Buy
397
533
38,691
29,141
31,051
14.4
15.0
32.3
35.6
12.3
11.1
2.1
1.9
17.1
17.0
1.2
1.0
Wipro
Neutral
271
-
132,001
55,421
58,536
20.3
20.3
35.1
36.5
7.7
7.4
1.3
1.2
19.2
14.6
1.8
1.6
Media
D B Corp
Neutral
371
-
6,831
2,297
2,590
27.4
28.2
21.0
23.4
17.7
15.9
4.1
3.6
23.7
23.1
2.8
2.4
HT Media
Neutral
88
-
2,037
2,693
2,991
12.6
12.9
7.9
9.0
11.1
9.7
0.9
0.9
7.8
8.3
0.3
0.2
Jagran Prakashan
Buy
171
225
5,575
2,283
2,555
28.0
28.0
10.6
12.3
16.0
13.9
3.4
3.0
21.4
21.4
2.5
2.2
Sun TV Network
Neutral
836
-
32,940
2,850
3,265
70.1
71.0
26.2
30.4
31.9
27.5
8.2
7.2
24.3
25.6
11.2
9.6
Hindustan Media
Neutral
276
-
2,026
1,016
1,138
24.3
25.2
27.3
30.1
10.1
9.2
1.9
1.7
16.2
15.8
1.3
1.1
Ventures
TV Today Network
Buy
253
344
1,510
608
667
21.5
22.3
15.7
19.2
16.1
13.2
2.5
2.1
16.1
16.0
2.1
1.8
Metals & Mining
Coal India
Neutral
255
-
158,320
84,638
94,297
21.4
22.3
24.5
27.1
10.4
9.4
4.3
4.1
42.6
46.0
1.4
1.2
Hind. Zinc
Neutral
280
-
118,478
14,252
18,465
55.9
48.3
15.8
21.5
17.8
13.0
2.9
2.5
17.0
20.7
8.3
6.4
Hindalco
Neutral
213
-
47,865
107,899
112,095
7.4
8.2
9.2
13.0
23.2
16.4
1.1
1.1
4.8
6.6
1.0
0.9
JSW Steel
Neutral
220
-
53,058
53,201
58,779
16.1
16.2
130.6
153.7
1.7
1.4
0.2
0.2
14.0
14.4
1.8
1.5
NMDC
Neutral
120
-
37,983
6,643
7,284
44.4
47.7
7.1
7.7
16.9
15.6
1.5
1.4
8.8
9.2
3.5
3.1
SAIL
Neutral
64
-
26,288
47,528
53,738
(0.7)
2.1
(1.9)
2.6
24.5
0.7
0.7
(1.6)
3.9
1.4
1.3
Vedanta
Neutral
273
-
101,610
71,744
81,944
19.2
21.7
13.4
20.1
20.4
13.6
1.7
1.6
8.4
11.3
1.8
1.4
Tata Steel
Neutral
571
-
55,456
121,374
121,856
7.2
8.4
18.6
34.3
30.7
16.7
1.9
1.8
6.1
10.1
1.1
1.1
Oil & Gas
GAIL
Neutral
379
-
64,168
56,220
65,198
9.3
10.1
27.1
33.3
14.0
11.4
1.3
1.2
9.3
10.7
1.3
1.1
ONGC
Neutral
163
-
209,246
137,222
152,563
15.0
21.8
19.5
24.1
8.4
6.8
0.7
0.7
8.5
10.1
1.8
1.6
Indian Oil Corp
Neutral
375
-
182,169
373,359
428,656
5.9
5.5
54.0
59.3
7.0
6.3
1.1
1.0
16.0
15.6
0.6
0.6
Stock Watch
July 20, 2017
Company Name
Reco
CMP
Target
Mkt Cap
Sales ( Čcr )
OPM(%)
EPS (Č)
PER(x)
P/BV(x)
RoE(%)
EV/Sales(x)
(Č)
Price ( Č)
( Č cr )
FY17E FY18E
FY17E
FY18E
FY17E
FY18E
FY17E
FY18E
FY17E
FY18E
FY17E
FY18E
FY17E
FY18E
Oil & Gas
Reliance Industries
Neutral
1,534
-
498,654
301,963
358,039
12.1
12.6
87.7
101.7
17.5
15.1
1.8
1.6
10.7
11.3
2.1
1.8
Pharmaceuticals
Alembic Pharma
Buy
543
648
10,241
3,101
3,966
19.7
20.5
21.4
25.5
25.4
21.3
5.4
4.4
23.0
22.8
3.3
2.4
Alkem Laboratories Ltd
Buy
1,783
2,161
21,314
5,853
6,901
17.1
18.4
74.6
85.0
23.9
21.0
5.0
4.2
21.1
20.2
3.6
3.1
Aurobindo Pharma
Accumulate
767
823
44,917
14,845
17,086
21.5
22.1
39.4
44.7
19.5
17.2
4.8
3.8
27.6
24.7
3.2
2.7
Aventis*
Neutral
4,209
-
9,694
2,206
2,508
16.6
16.8
128.9
139.9
32.7
30.1
5.6
4.4
21.6
23.5
4.2
3.5
Cadila Healthcare
Sell
544
450
55,717
9,220
11,584
18.4
20.3
14.5
18.7
37.5
29.1
8.0
6.5
23.5
24.6
6.4
4.9
Cipla
Sell
568
461
45,711
14,281
16,619
15.4
16.2
12.5
19.7
45.5
28.8
3.6
3.3
8.4
12.0
3.4
2.9
Dr Reddy's
Neutral
2,770
-
45,918
14,081
15,937
16.1
18.6
72.6
105.9
38.2
26.2
3.8
3.4
9.6
13.6
3.5
3.1
Dishman Pharma
Sell
143
1,718
1,890
22.7
22.8
9.5
11.3
10.1
10.9
3.3
2.9
GSK Pharma*
Neutral
2,555
-
21,641
2,927
3,290
11.8
16.2
34.4
49.6
74.3
51.5
10.8
11.2
13.9
21.3
7.2
6.5
Indoco Remedies
Sell
210
153
1,935
1,067
1,154
12.1
14.9
8.4
11.3
25.0
18.6
3.0
2.6
12.6
15.0
2.0
1.9
Ipca labs
Buy
480
620
6,056
3,211
3,593
13.9
14.5
15.4
19.4
31.2
24.7
2.5
2.3
8.2
9.5
2.0
1.8
Lupin
Buy
1,172
1,526
52,953
17,120
18,657
24.1
24.1
56.9
61.1
20.6
19.2
3.9
3.3
20.7
18.6
3.4
2.8
Natco Pharma
Accumulate
1,000
1,060
17,436
2,065
1,988
33.1
33.7
27.9
25.7
35.9
38.9
10.5
8.9
29.2
22.9
8.5
8.6
Sun Pharma
Buy
588
712
141,136
30,264
32,899
29.0
26.9
32.7
31.6
18.0
18.6
3.9
3.3
22.2
18.7
4.4
3.9
Power
Tata Power
Neutral
83
-
22,436
36,916
39,557
17.4
27.1
5.1
6.3
16.3
13.2
1.4
1.3
9.0
10.3
1.6
1.5
NTPC
Neutral
167
-
137,988
86,605
95,545
17.5
20.8
11.8
13.4
14.2
12.5
1.4
1.3
10.5
11.1
2.9
2.9
Power Grid
Neutral
219
-
114,363
25,315
29,193
88.2
88.7
14.2
17.2
15.4
12.7
2.3
2.1
15.2
16.1
9.2
8.2
Real Estate
Prestige Estate
Neutral
252
-
9,444
4,707
5,105
25.2
26.0
10.3
13.0
24.5
19.4
2.0
1.8
10.3
10.2
3.2
2.8
MLIFE
Buy
439
522
2,251
1,152
1,300
22.7
24.6
29.9
35.8
14.7
12.3
1.1
1.0
7.6
8.6
2.7
2.3
Telecom
Bharti Airtel
Neutral
421
-
168,430
105,086
114,808
34.5
34.7
12.2
16.4
34.5
25.7
2.3
2.2
6.8
8.4
2.5
2.2
Idea Cellular
Neutral
95
-
34,258
40,133
43,731
37.2
37.1
6.4
6.5
14.8
14.6
1.2
1.2
8.2
7.6
1.9
1.6
zOthers
Abbott India
Neutral
4,507
-
9,577
3,153
3,583
14.1
14.4
152.2
182.7
29.6
24.7
145.4
124.2
25.6
26.1
2.8
2.4
Asian Granito
Accumulate
429
480
1,290
1,066
1,169
11.6
12.5
13.0
16.0
33.0
26.8
3.2
2.9
9.5
10.7
1.5
1.3
Bajaj Electricals
Buy
333
395
3,382
4,801
5,351
5.7
6.2
10.4
13.7
32.0
24.4
4.0
3.5
12.4
14.5
0.7
0.6
Banco Products (India)
Neutral
233
-
1,669
1,353
1,471
12.3
12.4
14.5
16.3
16.1
14.3
22.2
20.0
14.5
14.6
1.2
126.3
Coffee Day Enterprises
Neutral
249
-
5,129
2,964
3,260
20.5
21.2
4.7
8.0
-
31.1
2.9
2.6
5.5
8.5
2.1
1.9
Ltd
Competent Automobiles Neutral
202
-
129
1,137
1,256
3.1
2.7
28.0
23.6
7.2
8.5
38.8
35.0
14.3
11.5
0.1
0.1
Elecon Engineering
Neutral
60
-
673
1,482
1,660
13.7
14.5
3.9
5.8
15.4
10.3
3.6
3.3
7.8
10.9
0.8
0.7
Stock Watch
July 20, 2017
Company Name
Reco
CMP
Target
Mkt Cap
Sales ( Čcr )
OPM(%)
EPS (Č)
PER(x)
P/BV(x)
RoE(%)
EV/Sales(x)
(Č)
Price ( Č)
( Č cr )
FY17E
FY18E
FY17E
FY18E
FY17E
FY18E
FY17E
FY18E
FY17E
FY18E
FY17E
FY18E
FY17E
FY18E
zOthers
Finolex Cables
Neutral
498
-
7,620
2,883
3,115
12.0
12.1
14.2
18.6
35.1
26.8
18.7
16.3
15.8
14.6
2.3
2.1
Garware Wall Ropes
Neutral
911
-
1,992
863
928
15.1
15.2
36.4
39.4
25.0
23.1
4.5
3.9
17.5
15.9
2.2
2.0
Goodyear India*
Neutral
909
-
2,096
1,598
1,704
10.4
10.2
49.4
52.6
18.4
17.3
84.9
74.5
18.2
17.0
1.0
142.6
Hitachi
Neutral
1,999
-
5,435
2,081
2,433
8.8
8.9
33.4
39.9
59.8
50.1
48.3
40.2
22.1
21.4
2.6
2.2
HSIL
Neutral
397
-
2,873
2,384
2,515
15.8
16.3
15.3
19.4
26.0
20.5
25.8
22.2
7.8
9.3
1.4
1.3
Interglobe Aviation
Neutral
1,257
-
45,440
21,122
26,005
14.5
27.6
110.7
132.1
11.4
9.5
67.9
48.5
168.5
201.1
2.1
1.7
Jyothy Laboratories
Neutral
365
-
6,639
1,440
2,052
11.5
13.0
8.5
10.0
43.0
36.5
10.4
9.6
18.6
19.3
4.9
3.4
Kirloskar Engines India
Neutral
399
-
5,770
2,554
2,800
9.9
10.0
10.5
12.1
38.0
33.0
15.9
15.0
10.7
11.7
1.9
1.7
Ltd
Linc Pen & Plastics
Neutral
281
-
415
382
420
9.3
9.5
13.5
15.7
20.8
17.9
3.6
3.1
17.1
17.3
1.2
1.0
M M Forgings
Neutral
659
-
795
546
608
20.4
20.7
41.3
48.7
16.0
13.5
90.2
79.8
16.6
17.0
1.3
1.2
Manpasand Bever.
Neutral
743
-
4,249
836
1,087
19.6
19.4
16.9
23.8
44.0
31.2
5.3
4.6
12.0
14.8
4.8
3.6
Mirza International
Neutral
158
-
1,903
963
1,069
17.2
18.0
6.1
7.5
25.8
21.1
3.9
3.4
15.0
15.7
2.2
2.0
MT Educare
Neutral
73
-
290
366
417
17.7
18.2
9.4
10.8
7.8
6.7
1.7
1.5
22.2
22.3
0.7
0.6
Narayana Hrudaya
Neutral
304
-
6,207
1,873
2,166
11.5
11.7
2.6
4.0
114.8
76.6
7.1
6.4
6.1
8.3
3.4
2.9
Navkar Corporation
Buy
202
265
2,874
347
371
43.2
37.3
6.7
6.0
30.2
33.6
2.1
1.9
6.2
10.6
9.4
8.8
Navneet Education
Neutral
177
-
4,134
1,062
1,147
24.0
24.0
6.1
6.6
29.1
26.7
6.0
5.3
20.6
19.8
4.0
3.7
Nilkamal
Neutral
1,934
-
2,886
1,995
2,165
10.7
10.4
69.8
80.6
27.7
24.0
110.5
96.0
16.6
16.5
1.4
1.3
Page Industries
Neutral
16,887
-
18,835
2,450
3,124
20.1
17.6
299.0
310.0
56.5
54.5
376.1
287.1
47.1
87.5
7.7
6.1
Parag Milk Foods
Neutral
244
-
2,056
1,919
2,231
9.3
9.6
9.5
12.9
25.9
18.9
4.0
3.3
15.5
17.5
1.2
1.0
Quick Heal
Neutral
227
-
1,591
408
495
27.3
27.0
7.7
8.8
29.3
25.8
2.7
2.7
9.3
10.6
3.0
2.5
Radico Khaitan
Accumulate
133
147
1,766
1,667
1,824
13.0
13.2
6.7
8.2
20.0
16.2
1.8
1.7
9.0
10.2
1.4
1.3
Relaxo Footwears
Neutral
499
-
5,999
2,085
2,469
9.2
8.2
7.6
8.0
66.1
62.8
25.6
21.9
17.9
18.8
3.0
2.5
S H Kelkar & Co.
Neutral
263
-
3,805
1,036
1,160
15.1
15.0
6.1
7.2
43.1
36.7
4.6
4.2
10.7
11.5
3.5
3.1
Siyaram Silk Mills
Neutral
2,453
-
2,299
1,574
1,769
12.5
12.7
97.1
113.1
25.3
21.7
3.9
3.4
15.4
15.5
1.7
1.5
Styrolution ABS India*
Neutral
1,062
-
1,868
1,440
1,537
9.2
9.0
40.6
42.6
26.2
24.9
66.8
60.7
12.3
11.6
1.3
1.1
Surya Roshni
Neutral
286
-
1,255
3,342
3,625
7.8
7.5
17.3
19.8
16.6
14.5
31.5
25.3
10.5
10.8
0.6
0.6
Team Lease Serv.
Neutral
1,426
-
2,439
3,229
4,001
1.5
1.8
22.8
32.8
62.7
43.4
6.7
5.8
10.7
13.4
0.7
0.5
The Byke Hospitality
Neutral
191
-
766
287
384
20.5
20.5
7.6
10.7
25.1
17.9
5.3
4.3
20.7
23.5
2.7
2.0
Transport Corporation of
Neutral
324
-
2,481
2,671
2,911
8.5
8.8
13.9
15.7
23.4
20.7
3.2
2.9
13.7
13.8
1.0
1.0
India
Stock Watch
July 20, 2017
Company Name
Reco
CMP
Target Mkt Cap
Sales ( Čcr )
OPM(%)
EPS (Č)
PER(x)
P/BV(x)
RoE(%)
EV/Sales(x)
(Č)
Price ( Č)
( Č cr )
FY17E FY18E FY17E FY18E FY17E FY18E FY17E FY18E FY17E FY18E FY17E FY18E FY17E FY18E
zOthers
TVS Srichakra
Neutral
3,768
-
2,885
2,304
2,614
13.7
13.8
231.1
266.6
16.3
14.1
423.3
333.3
33.9
29.3
1.3
1.1
UFO Moviez
Neutral
391
-
1,079
619
685
33.2
33.4
30.0
34.9
13.1
11.2
1.8
1.6
13.8
13.9
1.5
1.1
Visaka Industries
Neutral
497
-
789
1,051
1,138
10.3
10.4
21.0
23.1
23.7
21.5
63.7
59.7
9.0
9.2
1.0
1.0
VRL Logistics
Neutral
321
-
2,930
1,902
2,119
16.7
16.6
14.6
16.8
22.1
19.1
4.8
4.2
21.9
22.2
1.7
1.5
VIP Industries
Buy
179
218
2,527
1,270
1,450
10.4
10.4
5.6
6.5
31.9
27.5
6.6
5.8
20.7
21.1
2.0
1.7
Navin Fluorine
Accumulate
672
730
3,308
789
945
21.1
22.4
24.0
28.7
28.0
23.4
4.5
3.9
17.8
18.5
4.1
3.4
Source: Company, Angel Research; Note: *December year end; #September year end; &October year end; Price as on July 19, 2017
Market Outlook
July 20, 2017
DISCLAIMER
Angel Broking Private Limited (hereinafter referred to as “Angel”) is a registered Member of National Stock Exchange of India
Limited,Bombay Stock Exchange Limited and Metropolitan Stock Exchange Limited. It is also registered as a Depository Participant with
CDSL and Portfolio Manager with SEBI. It also has registration with AMFI as a Mutual Fund Distributor. Angel Broking Private Limited is a
registered entity with SEBI for Research Analyst in terms of SEBI (Research Analyst) Regulations, 2014 vide registration number
INH000000164. Angel or its associates has not been debarred/ suspended by SEBI or any other regulatory authority for accessing
/dealing in securities Market. Angel or its associates/analyst has not received any compensation / managed or
co-managed public offering of securities of the company covered by Analyst during the past twelve months.
This document is solely for the personal information of the recipient, and must not be singularly used as the basis of any investment
decision. Nothing in this document should be construed as investment or financial advice. Each recipient of this document should make
such investigations as they deem necessary to arrive at an independent evaluation of an investment in the securities of the companies
referred to in this document (including the merits and risks involved), and should consult their own advisors to determine the merits and
risks of such an investment.
Reports based on technical and derivative analysis center on studying charts of a stock's price movement, outstanding positions and
trading volume, as opposed to focusing on a company's fundamentals and, as such, may not match with a report on a company's
fundamentals. Investors are advised to refer the Fundamental and Technical Research Reports available on our website to evaluate the
contrary view, if any.
The information in this document has been printed on the basis of publicly available information, internal data and other reliable
sources believed to be true, but we do not represent that it is accurate or complete and it should not be relied on as such, as this
document is for general guidance only. Angel Broking Pvt. Limited or any of its affiliates/ group companies shall not be in any way
responsible for any loss or damage that may arise to any person from any inadvertent error in the information contained in this report.
Angel Broking Pvt. Limited has not independently verified all the information contained within this document. Accordingly, we cannot
testify, nor make any representation or warranty, express or implied, to the accuracy, contents or data contained within this document.
While Angel Broking Pvt. Limited endeavors to update on a reasonable basis the information discussed in this material, there may be
regulatory, compliance, or other reasons that prevent us from doing so.
This document is being supplied to you solely for your information, and its contents, information or data may not be reproduced,
redistributed or passed on, directly or indirectly.
Neither Angel Broking Pvt. Limited, nor its directors, employees or affiliates shall be liable for any loss or damage that may arise from
or in connection with the use of this information.